GIS, Remote Sensing and Other Technologies
Bardekjian, A. & Puric-Mladenovic, D. (2025). GIS, Remote Sensing and Other Technologies. In Growing Green Cities: A Practical Guide to Urban Forestry in Canada. Tree Canada. Retrieved from Tree Canada: https://treecanada.ca/urban-forestry-guide/gis-remote-sensing-and-other-technologies/
Highlights
Technologies
GIS, remote sensing, LiDAR, and orthoimagery, and how they are used in urban forestry.
Overview
GIS and remote sensing in urban forestry.
Technologies like Geographic Information Systems (GIS), remote sensing, other web-based spatial technologies, and relevant software are widely used to support urban forest management, conservation, and planning. They allow the mapping, cataloguing, inventory, and monitoring of urban forest characteristics from the scale of individual trees, woodlots, and urban green spaces to an entire urban tree canopy (Ward & Johnson, 2007). Besides mapping trees, they also allow mapping of the urban environment and environmental conditions where urban trees grow. There is a diversity of GIS and remote sensing technologies in use and development, and a diversity of spatial and remotely sensed urban forest-related data. Some of the technologies have been designed for use in urban forestry, and some have been developed in other professions and adopted by the urban forestry sector (Green Municipal Fund, n.d.). This chapter briefly summarizes technologies used in urban forestry and provides a list of Canada’s relevant examples.
Geographic Information Systems (GIS)
Geographic Information Systems (GIS) have played a pivotal role in natural resources management, and thus urban forestry, for decades. Since the 1980s, particularly in 1990, with spatial technology and software development and growth, GIS has become a critical tool for urban forest management and decision-making. For example, GIS enables detailed tree and canopy mapping, analysis, and management of tree population data. GIS creates spatial tree inventories containing species, health, size, and more information. Such spatial tree data facilitates more effective and adaptive urban forest management and monitoring, critical for informing tree planting strategies and sustainable and evidence-based urban development.
Additionally, GIS, combined with remote sensing, enables sampling of the entire urban area, supports timely urban forest monitoring, and detects urban forest decline and pest infestations, to name a few applications. Furthermore, by integrating urban forest spatial data with urban planning, GIS supports future urban forest planning and enhances urban forest conservation in the face of increased urban intensification and development. Moreover, GIS facilitates using other spatial data (e.g. Digital Elevation Models, infrastructure mapping, and soil zones) to provide context about a proposed planting site, potentially protect trees and green areas, and other urban forestry projects (Kip, 2022).
Numerous commercial and open-source GIS software exist and are utilized in urban forestry. Commercial GIS programs like ESRI ArcGIS Pro are widely used across municipalities, governments, and larger NGOs. MapInfo Professional is another commercial software that has mapping and spatial analysis tools suitable for urban forest management and land use planning. In the open-source category, QGIS is certainly one of the most popular GIS platforms. It has a wide range of tools for mapping, geospatial analysis, and data visualization. GRASS GIS is an advanced open-source GIS, particularly for use with remotely sensed images. It has powerful analytical capabilities. Each of these tools enables spatial database creation, data maintenance, mapmaking, analysis, and reporting. For example, they can be used to create and maintain databases of individual street trees, facilitate tree health risk and assessment, track tree removal and work planning, analyze and map woodland and urban forest characteristics, and more.
Municipalities, provincial governments, and some larger NGOs typically use Esri software to manage their data, conduct analyses, and share the information with the public. By taking advantage of web mapping, Canadian municipalities share street tree inventories with the public. For example, Vancouver, Ottawa, Charlottetown, Oakville, Winnipeg, and Montreal have their tree inventory data online. GIS in combination with web mapping also supports specific interactive web applications and other forms of knowledge sharing, reporting, and science communication that allow the public and other interest groups to view and understand forestry data easily. Examples of interactive web applications include Nature Canada’s 2022 report on tree equity and the associated Canadian Map of Adaptation Actions, the City of Toronto’s Tree Equity Map, and Calgary’s urban forest management map.
Mobile and web-based GIS tools and applications are also used to collect urban forest information and engage the public in data gathering and urban forest monitoring. These platforms enable citizens, researchers, and the broader public to contribute to the inventory, monitoring, and management of urban forests and their biodiversity. For example, iNaturalist has been used to track urban biodiversity and upload photos and locations of observed plants, wildlife, and insects. The Neighbourwoods© program has been using mobile GIS applications to support inventory and monitoring trees on private urban lands by engaging community groups and graduate students in data collection.
Remote Sensing
Collecting data and sampling the entire urban forest through field surveys alone would be challenging and not economically feasible. Remote sensing is a method of collecting spatial data across entire study areas without direct contact with the observed objects, and it plays a crucial role in urban mapping, management, conservation, and planning. Remote sensing provides critical insight into urban forest extent, structure, composition, and dynamics by capturing broad-scale, consistent, and repeatable data. Remote sensing products include multiple spectral imagery of forestry, such as remote sensing, airborne sensing, drone imagery and LiDAR (Staley, 2022). The advantage of remote sensing is that it frequently enables sampling of the entire urban forest and provides high-resolution data with diverse derivatives and multiple applications. For example, high-resolution satellite imagery and LiDAR allow for precise urban tree canopy cover mapping across entire cities.
Remote sensing technologies with hyperspectral and multispectral sensors help identify vegetation stress and even specific tree species. Remotely sensed images and their derivative tools also enable consistent monitoring that can help to detect the effects of environmental and climate changes, phenology change, and green space loss, and can even be used to evaluate the effectiveness of urban forestry programs (e.g., tree planting efforts). Through remote sensing technologies, urban foresters can evaluate health, distribution, and changes in vegetation, as well as the impacts of urbanization. Besides providing information about urban forests and trees, satellite and airborne remote sensing platforms also enable monitoring of environmental factors such as temperature, urban heat island effects, pollution, and soil moisture.
Remotely Sensed Images Used in Urban Forestry
Satellite-based remote sensing collects and analyzes data about Earth’s surface and atmosphere using satellite sensors. It enables large-scale, consistent, and repeatable monitoring of various environmental and urban features (Wulder et al., 2024; Latifovic et al., 2015). Images from satellite-based remote sensing are free or commercial. Both free and commercial imagery play complementary roles, with free data offering broader accessibility and commercial data providing greater detail and precision for specialized applications.
Free satellite imageries are openly accessible for public use and are widely used for research, education, and non-commercial purposes. While these datasets are free, they may have limitations in terms of spatial resolution. For example, Landsat Data has multispectral imagery with 30m resolution (15m panchromatic) and a temporal resolution of 16 days. Sentinel-2 (ESA) imagery is high-resolution imagery (10-60m resolution) with multispectral bands. Like Landsat, it is suitable for urban forestry and land cover classification, and tree canopy analysis. MODIS (NASA) is imagery taken daily and has moderate-resolution imagery (250m-1km) applicable for broad-scale monitoring of vegetation, land cover, and global change, with limited application to urban forests.
Commercial imagery provides finer spatial, temporal, and spectral resolution specialized data products, but they can be cost-prohibitive, especially for large-scale or long-term projects. There are many commercial satellite imageries based on purchase or subscription, like PlanetScope (Planet) high-resolution imagery, which is taken daily. Older imagery has a resolution of 5m, while images taken by newer satellites have a resolution of around 3m. These images do not have a panchromatic band. They have 4 multispectral bands (Blue, Green, Red, and Near-Infrared). GeoEye-1 has one panchromatic band with a resolution of 41cm and four multispectral bands (Blue, Green, Red, and Near-Infrared) at a resolution of 1.65m. WorldView Series (Maxar) is high-resolution imagery up to 30cm and provides multispectral and high-resolution panchromatic images. The multispectral WorldView satellite images provide data in multiple spectral bands, which are useful for urban forestry. WorldView-2 imagery has 8 multispectral bands (coastal, blue, green, yellow, red, red edge, NIR1, NIR2) with a spatial resolution of 1.84m. Its panchromatic band has a resolution of 0.46m. WorldView-3 images (and WorldView-4 decommissioned in 2019) have 1.24m resolution for 8 standard multispectral bands, 8 shortwave infrared (SWIR) bands, and 0.31m resolution for a panchromatic band.
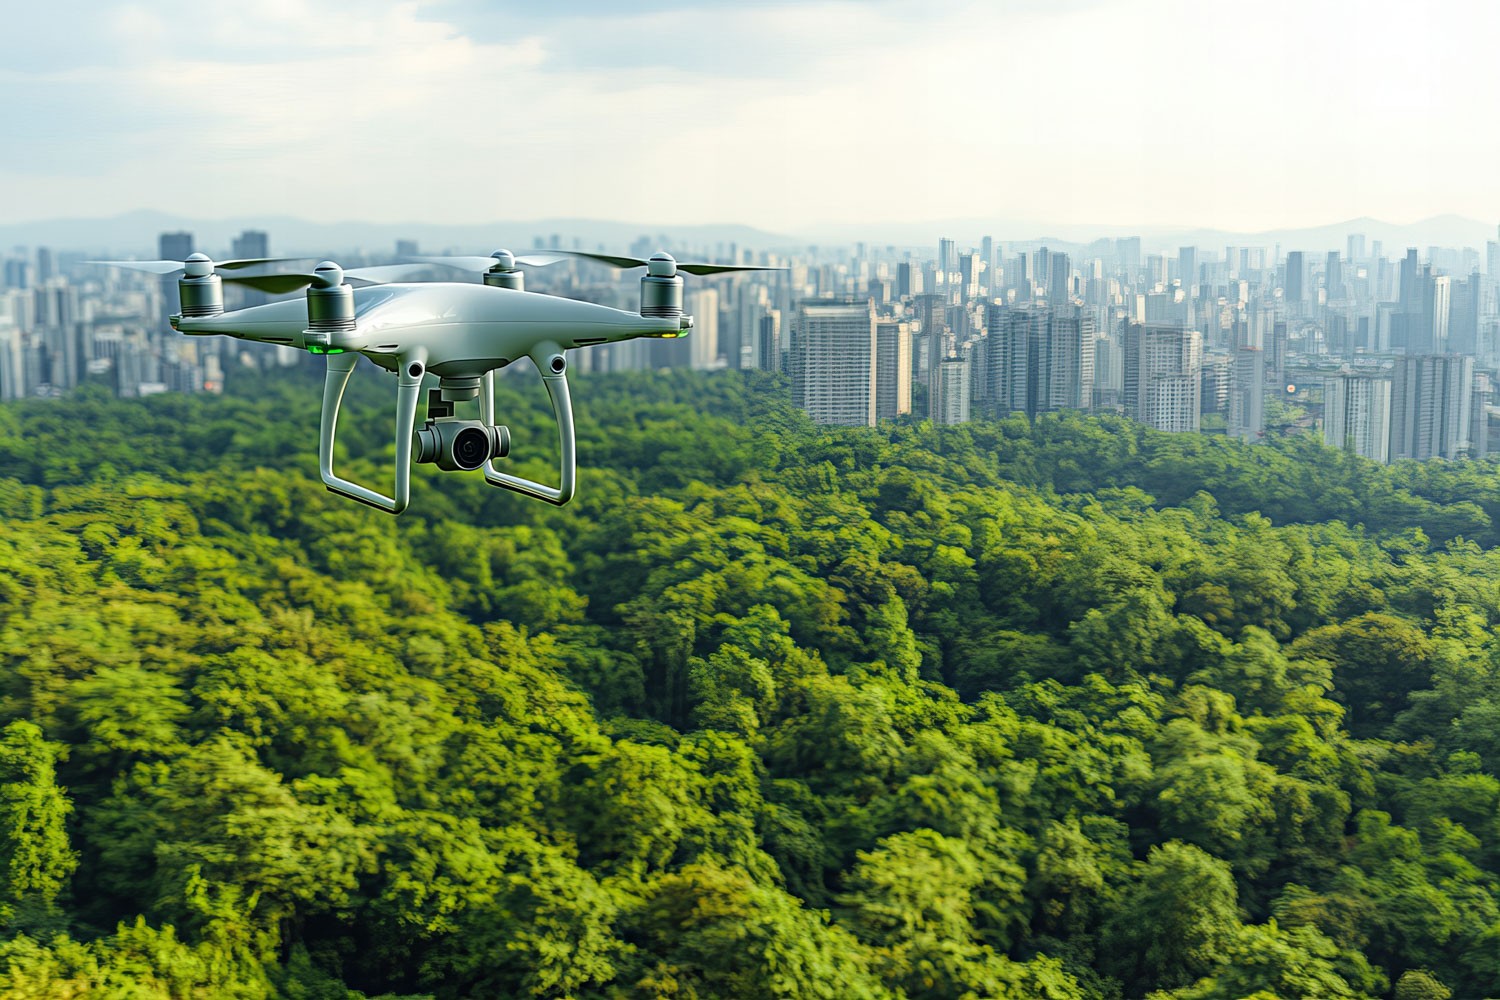
Airborne remote sensing is used to capture high-resolution data about urban forests. Airborne remote sensing requires aircraft or drones equipped with multispectral, hyperspectral, or LiDAR sensors. Similar to airborne remote sensing, UAVs (Unmanned Aerial Vehicles or Drones) are equipped with multispectral cameras and LiDAR or sensors. This makes airborne and UAV remote sensing especially valuable for monitoring and mapping urban forests and green spaces, detecting changes in forest cover, and using their outputs to support urban forest management and plan for sustainable urban development.
LiDAR (Light Detection and Ranging) uses lasers to generate point clouds representing the real world as the lasers encounter obstacles such as buildings, tree branches, and vegetation cover. These point clouds can then be classified by what they represent in order to generate models of the real world used in these analyses. These datasets are becoming more available to the general public as their use increases (Natural Resources Canada, 2023). LiDAR provides detailed 3D topography and 3D models of tree heights and canopy density. Once processed for practical uses, this data offers detailed spatial information for specific uses, such as canopy height models to support tree inventory risk assessment and forest structure assessment. LiDAR analysis of an area can be used to estimate the leaf area and crown density of individual trees or entire regions, creating more accurate canopy cover estimates as technology evolves (LidarBC, n.d.). LiDAR is also commonly used as a tool for forest inventory (Natural Resources Canada, 2024; Ontario Woodlot Association, n.d.), and there has been an exploration of LIDAR as a tool for fire risk classification (Burns, 2012) and natural disaster impact assessment (Blackman & Yuan, 2020).
Red, Green, and Blue (RGB) are basic spectral bands used to visually view, assess, and map vegetation in urban areas. Near-infrared (NIR) bands are sensitive to vegetation health and can be used to distinguish tree canopy from other land uses. For example, shortwave infrared (SWIR) is useful in detecting moisture content in vegetation and providing insights into tree health and stress. Depending on the available spectral bands and imagery used, a combination of spectral bands is possible to derive various vegetation indices that provide information about the urban canopy. For example, the Normalized Difference Vegetation Index (NDVI), widely used to assess vegetation density and health, is derived from NIR and red bands. Enhanced Vegetation Index (EVI, as a variation of NDVI) might be more sensitive to mapping dense vegetation. The availability of near-infrared (NIR) and red-edge bands is particularly valuable for vegetation analysis, canopy mapping, and detecting tree health in urban forestry applications. For example, Leaf Area Index (LAI) can be estimated from NIR and field survey LAI to create urban forest LAI across a wider area (Ren et al., 2018; Le Saint et al., 2024) using Lidar data (Alonzo et al., 2015).
In addition, various airborne or satellite hyperspectral images can be used to map tree canopy health, detect vegetation stress, or classify vegetation. They can even identify species and leaf biochemical properties such as chlorophyll content, leaf area index (LAI), or water content. For example, AVIRIS is an airborne sensor with 224 spectral bands. HyMap has 126 spectral bands, and SpecTIR offers hyperspectral data across hundreds of bands. The EO-1 satellite, Hyperion, has 220 spectral bands, while PRISMA, from the Italian Space Agency, delivers 239 bands that can be used to support and inform environmental monitoring and urban forestry management. While hyperspectral imagery has high spectral resolution and is complex, it creates a large volume of data, requiring specialized remote sensing software to manage data and extract meaningful urban forest information.
Aerial Orthoimagery
Digital Orthophotography (Orthoimagery) is aerial or satellite imagery, typically RGB and geometrically corrected (orthorectified) to remove distortions caused by terrain, camera angles, and lens distortion. It is commonly used to visually represent landscapes and as a base map in GIS. The advantage of orthoimages is that they are publicly available and shared by provinces or municipalities, and they can have a pixel resolution of 16cm and an accuracy of 45cm, which allows for precise identification of tree locations within urban environments and makes them suitable for mapping tree locations.
These imagery-based maps are widely used in GIS applications. As high-resolution imagery, they are overlaid with vector or raster data to provide quick spatial context and verify spatial data accuracy. Imagery-based maps are image layers that display satellite or aerial photographs of the Earth’s surface. For example, Esri has included a high-quality aerial imagery-based map that is part of Esri’s Living Atlas of the World. Unlike Esri products, QGIS does not have a native-based map, but with adequate plugins, it can use Google Maps, Bing Maps, and other services as base maps. For example, though time-consuming for larger areas, digital orthophotography and base maps can be used to digitize tree canopy outlines for smaller areas (e.g. parcel).
Tools and Technologies
Spatial Data Tools/GIS
Free/public domain technologies and GIS
- City of Calgary, Esri. (n.d.). Urban Forest Management – Interactive Map.
- Evergreen. (n.d.). AI for the Resilient City – About the Project.
- Google Earth. (n.d.). Overview – The World’s Most Detailed Globe.
- HealthyPlan. (n.d.). HealthyPlan City – Explore Equity in Your City.
- Natural Resources Canada, (n.d.). Registry of Open Data on AWS.
- QGIS Association. (n.d.). QGIS Geographic Information System – Open Access.
Paid/membership model technologies and GIS
- ESRI. (2011). ArcGIS Desktop: Release 10.8 – Overview. Redlands, CA: Environmental Systems Research Institute.
- ESRI. (2023). ArcGIS Solutions – Introduction to Tree Management.
- https://doc.arcgis.com/en/arcgis-solutions/latest/reference/introduction-to-tree-management.htm
- Note: Valid license for Esri ArcGIS required.
Tree-Related Tools
Tree Inventory
- American Forests. (2024). Discover Tree Equity Score.
- iNaturalist. (2024). A Community for Naturalists – How it Works.
- i-Tree International Database. (n.d.). i-Tree International Database – About.
- Open Ottawa. (2024). Tree Inventory.
- Open Tree Map. (2024). Flexible all-in-one urban tree inventory and ecosystem services calculations tool.
- Texas A&M Forest Service. (2024). Trees Count Mobile App – Download.
- Quebio. (n.d.). Arbres publics de Montréal.
Tree Risk Assessment
- International Society of Arboriculture. (2018). Basic Tree Risk Assessment Form.
- Texas A&M Forest Service. (2024). Tree Risk Mobile App – Download.
Dendrology tools
- Regent Instruments. (2023). Image Analysis for Plant Science – Products.
Plant and pest/disease identification
- Perdue University. (n.d.). Purdue Plant Doctor.
- Native Plant Trust. (n.d.). Go Botany Plant ID Tools.
- Virginia Tech. (2024). Virginia Tech Tree ID – App Download. Retrieved from Google Play.
- Glority LLC. (2024). PictureThis Plant ID app– Botanist in Your Pocket.
Orthoimagery
- City of Vancouver. (2022). Orthophoto Imagery 2022 – dataset.
- Government of British Columbia. (n.d.). Maps & Orthos.
- McGill Libraries. (n.d.). CanImage – Data Download.
- Ontario Ministry of Natural Resources. (2023). Ontario Imagery Program. Geospatial Ontario
Resources
Canadian
- Canada in a Changing Climate: Advancing our Knowledge for Action. (2024). Map of Adaptation Actions.
- Green Municipal Fund. (n.d.). Factsheet: Urban forestry technology and tools.
- Healthy Plan City. (2024). Explore equity in your city – interactive map.
- Kip, J. (2022). Assessing Candidate Protected Areas using GIS Technology. Ontario Nature.
- LidarBC. (2023). British Columbia is investing in better data.
- Natural Resources Canada (NRCan). (2023). New LiDAR Point Clouds product: Canada as you’ve never seen it before! Retrieved from Government of Canada.
- Natural Resources Canada (NRCan). (2024). Aerial LiDAR and forest inventory monitoring.
- Nature Canada. (2022). Canada’s Urban Forests: Bringing the canopy to all (September 2022).
- Ontario Woodlot Association. (n.d.). Private Forest Inventory Program.
- Standards Council of Canada. (2022). Urban Heat Island Mapping Workshop: What We Heard.
Non-Canadian
- American Forests. (2024). Tools, Research, Reports & Guides.
- Portland Parks & Recreation Urban Forestry. (2024). Street Tree Inventory.
Further Reading
- Alonzo, M., Bookhagen, B., McFadden, J. P., Sun, A. and Roberts, D. A. (2015). Mapping urban forest leaf area index with airborne lidar using penetration metrics and allometry. Remote Sensing of Environment, 162, 141-153.
- Blackman, R., & Yuan, F. (2020). Detecting Long-Term Urban Forest Cover Change and Impacts of Natural Disasters Using High-Resolution Aerial Images and LiDAR Data. Remote Sensing, 12(11), 1820.
- Burns, J. (2012). Applications of LIDAR in Wildlife Management: an opportunity in British Columbia.
- Latifovic, R., Pouliot, D., and Olthof, I. (2009) North American Land Change System: Canadian Perspective. 30th Canadian Symposium on Remote Sensing, Lethbridge, Alberta. Retrieved from Government of Canada
- Le Saint, T., Nabucet, J., Hubert-Moy, L., & Adeline, K. (2024). Estimation of Urban Tree Chlorophyll Content and Leaf Area Index Using Sentinel-2 Images and 3D Radiative Transfer Model Inversion. Remote Sensing, 16(20), 3867.
- Münzinger, M., Prechtel, N. and Behnisch, M. (2022). Mapping the urban forest in detail: From LiDAR point clouds to 3D tree models. Urban Forestry & Urban Greening 74, 127637.
- Nitoslawski, S. and Konijnendijk, C. C. (2022). The Emergence of Smart Urban Forestry: Challenges and Opportunities in the Digital Age. Arboriculture & Urban Forestry, 48(2), 45-48.
- Ren, Z., Du, Y., He, X. et al. Spatiotemporal pattern of urban forest leaf area index in response to rapid urbanization and urban greening. Journal of Forestry Research, 29, 785–796 (2018).
- Staley, D. C. (2022). Modern Urban Forestry for Modern Cities: Technology Challenges and Opportunities for the Remote Sensing of Urban Forests. Arboriculture & Urban Forestry (AUF) 48(2), 147-163.
- Ward, K. T. and Johnson, G. R. (2001). Geospatial methods provide timely and comprehensive urban forest information. Urban Forestry & Urban Greening, 6(1), 15-22.
- Wulder, M., Hermosilla, T., White, J., Bater, C., Hobart, G. and Bronson, S. (2024). Development and implementation of a stand-level satellite-based forest inventory for Canada. Forestry: An International Journal of Forest Research. 97.